PSL Scale Explained: What the Looksmaxxing Rating Really Means
The PSL scale is an informal online framework used to rank facial appearance. It is associated with looksmaxxing communities and internet tier language, but it is not a medical scale, a validated population measurement or an officially standardized system.
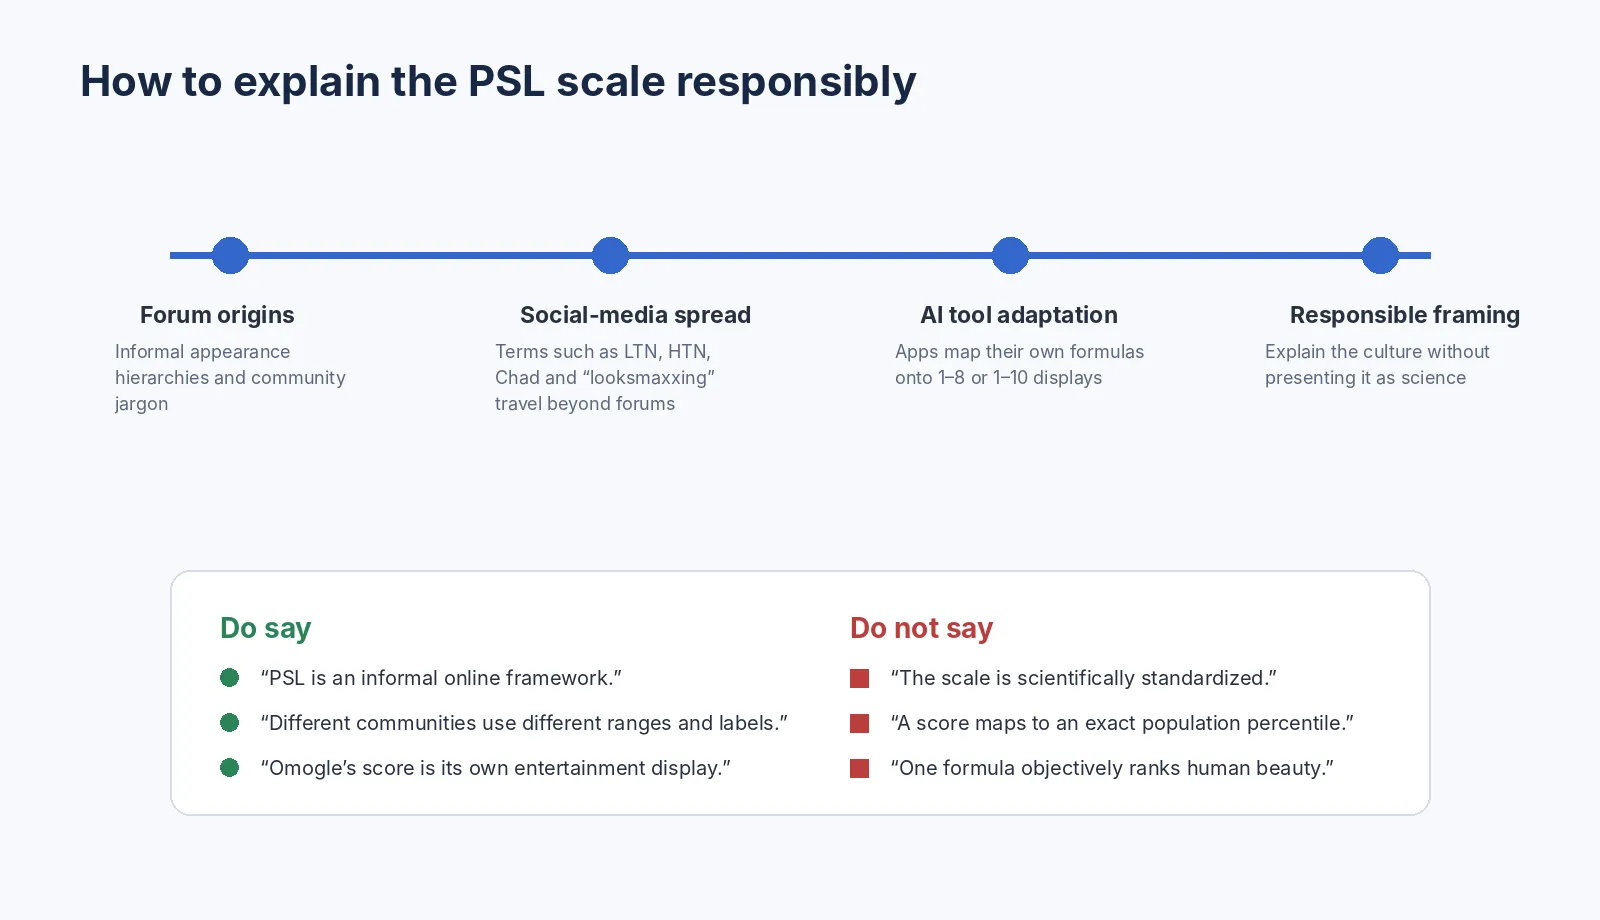
Different communities use different numerical ranges, definitions and labels. Historical versions are often described as roughly 1–8, while many newer apps display 1–10. A “PSL 6” therefore does not have one universal meaning.
Published 2026-08-06 · Last reviewed 2026-08-06
What does PSL stand for?
The meaning is disputed and has changed as the term spread. Some modern tools expand PSL as “Prettiness Scale Level.” That phrasing is easier to market, but it should not be presented as the uncontested historical origin.
Academic research and reporting on looksmaxxing connect PSL to earlier forums including PUAHate, SlutHate and Lookism. A 2025 peer-reviewed study examines how looksmaxxing, “Sub5” language and the PSL scale can repackage older incel ideology for mainstream digital platforms.
Because the acronym has been reinterpreted, the page should explain the ambiguity instead of insisting that one expansion is definitively correct.
Is the PSL scale 1–8 or 1–10?
Both versions exist.
- Historical looksmaxxing descriptions often use an approximately 1–8 hierarchy.
- Contemporary consumer apps frequently use 1–10 because it resembles familiar attractiveness ratings.
- Some communities use decimals or named tiers instead of whole-number boundaries.
- The same number can mean different things across communities and products.
Omogle uses a 1–10 display. That makes it Omogle’s interpretation of PSL-style terminology — not the official implementation of a universal scale.
Where did the PSL scale come from?
The scale developed in online communities that attempted to categorize appearance using a shared vocabulary. Users discussed facial harmony, angularity, dimorphism, symmetry and individual features, then placed people into hierarchical tiers.
The language spread beyond its original forums through memes, short-form video and looksmaxxing content. As it reached wider audiences, the framework was often detached from — or obscured — the misogynistic and fatalistic ideas present in some of its earlier communities.
Recent academic work describes this process as a form of digital subcultural diffusion: technical language and self-improvement framing can make fringe ideology appear neutral or scientific. A useful PSL article should explain that history without endorsing the hierarchy.
Common PSL terms
Tier labels vary. The following terms are part of online slang, not clinical or scientific categories:
| Term | Common online use | Responsible editorial treatment |
|---|---|---|
| LTN | Usually “low-tier normie” | Explain as slang; do not apply it to a real person |
| MTN | Usually “mid-tier normie” | Explain variation between communities |
| HTN | Usually “high-tier normie” | Do not convert it to a population percentile |
| Chadlite | A tier below the “Chad” archetype | Identify it as meme-based hierarchy |
| Chad / GigaChad | Exaggerated attractive-male archetypes | Explain cultural context; do not present as objective taxonomy |
| Sub5 | A derogatory label for someone rated below a threshold | Describe as harmful/dehumanizing terminology; avoid normalizing it |
Some versions also use gendered or openly insulting labels. There is no need to reproduce a full slur-based chart for SEO. Doing so adds little educational value and can reinforce appearance-based harassment.
Why exact PSL population charts are misleading
Many pages claim that a score corresponds to an exact percentile — for example, that one tier represents the top 5% of the population. Such claims require a representative population sample, a fixed scoring instrument, a validated rating process and published statistical analysis.
The PSL ecosystem has none of the following in one shared system:
- a standards authority;
- one agreed formula;
- a representative global dataset;
- a fixed panel of trained raters;
- validated demographic norms;
- an accepted error range;
- one definition of each tier.
Without those elements, precise percentages are invented precision. Omogle should remove all claims that 5 is a measured population average, most people fall in a specific range, or a score equals an exact top percentile.
Is PSL scientific?
The community scale itself is not a validated scientific instrument. Some of the concepts discussed around it can be measured in a photograph, including distances, landmark differences and defined angles. That does not make the final ranking scientific.
Several subjective decisions intervene:
- Which features are included.
- Which value or direction is considered preferable.
- How each feature is weighted.
- Whether the same preferences are assumed for every culture, gender and person.
- How measurements are converted into a score and tier.
Objective calculation of selected coordinates is not the same as objective measurement of beauty.
What can research tell us?
Researchers have studied facial attractiveness judgments and have built models that predict average ratings in defined datasets. That work can reveal patterns within the study design. It does not produce an official PSL scale.
For example, the original SCUT-FBP benchmark included 500 Asian female subjects with human attractiveness ratings. A model evaluated on that set may learn relationships relevant to its images and raters, but the dataset cannot establish a global population hierarchy.
Other research emphasizes individual variation in facial preference. The existence of some shared tendencies does not eliminate subjectivity or justify labeling people with permanent social tiers.
How Omogle uses PSL terminology
Omogle displays a 1–10 PSL-style entertainment result derived from its current facial-landmark formula. The page should state clearly:
- The score is Omogle’s own display, not an official PSL standard.
- Five is the midpoint of the display, not a proven population average.
- The result is specific to one image and one software version.
- The score is not a population percentile.
- The score is not a diagnosis or a measure of personal worth.
- The active metrics and weights are documented on the Methodology page.
A responsible way to explain Omogle’s 1–10 display
| Displayed range | Permitted explanation | Do not claim |
|---|---|---|
| 1–3 | Lower end of Omogle’s internal scoring output | A fixed “bottom percentage” of people |
| 4–6 | Middle area of Omogle’s displayed range | That most people statistically fall here |
| 7–8 | Higher output under Omogle’s current formula | That the person is objectively superior or top X% |
| 9–10 | Extreme upper end of the formula’s display | That the result proves universal beauty |
This table explains the interface only. It must not be illustrated with real people labeled as low or high-value examples.
Why can a PSL-style score change?
- head angle and rotation;
- camera distance and perspective;
- expression;
- lighting and shadow;
- image resolution and compression;
- filters and retouching;
- landmark placement;
- model or formula updates.
A different result does not necessarily indicate a different face. It often indicates a different photograph. The exact same file is the proper input for a repeatability check.
Is there a good PSL score?
There is no scientifically defined good PSL score. Within a particular application, a higher number means the image aligned more closely with that application’s preferred criteria.
It does not establish better health, greater personal value, stronger relationships, career success or universal appeal. A healthy interpretation focuses on what the application measured and how the image affected the output — not where the person belongs in a hierarchy.
Risks of taking the scale too seriously
- repeated selfie testing and reassurance seeking;
- fixation on normal asymmetry;
- comparison of incompatible tools;
- appearance-based bullying and dehumanizing labels;
- unsafe attempts to change bone structure;
- distress about a score that has no validated life meaning.
If a number begins to affect eating, sleep, school, work, relationships or self-esteem, stop using rating tools. An online tier system is not a reliable guide to health or life decisions.
Frequently asked questions
What is the PSL scale?
What does PSL stand for?
Is PSL 1–8 or 1–10?
Is 5 the average PSL score?
Is PSL objective?
Can scores from different tools be compared?
Can my PSL score change?
References
- [1] Solea & Sugiura, Digital subcultural diffusion theory — Peer-reviewed analysis of looksmaxxing, Sub5s and PSL terminology.
- [2] Xie et al., SCUT-FBP benchmark — Example of a specific facial-attractiveness dataset; not a universal PSL norm.
- [3] Oh et al., Subjectivity and complexity of facial attractiveness — Evidence of individual preference variation.
- [4] Omogle Methodology — Product-specific source for current scoring implementation.
- [5] Omogle Editorial Policy — Rules for unsupported percentages, ideal angles and health claims.